How To Blend Data In Looker Studio: A Comprehensive Guide

In this article, we'll aim to cover how to blend data in Looker Studio, concisely, comprehensively and without any of the noise.
What Is Data Blending In Looker Studio?
Data blending in Looker Studio is a method used to combine data from multiple sources into a single cohesive dataset, providing a complete and unified view of information.
It's primary use case is when valuable insights are scattered across different datasets, hindering effective analysis in isolation.
The Benefits Of Data Blending In Looker Studio
Data blending offers various advantages that enhance the data analysis process, including:
- A Comprehensive View: By merging information from different sources, data blending allows for a more holistic view of data, allowing you to make better informed decisions.
- Time Saving: Manual wrangling of data from multiple sources can be a time-consuming process. Data blending in Looker Studio can save time by offering a relatively straight forward process to join datasets together.
The Limitations Of Data Blending In Looker Studio
Although data blending in Looker Studio can be a great tool when used effectively, it also has some limitations to consider:
- Number Of Data Sources: Currently, Google Data Studio allows the blending of up to only 5 data sources at a time.
- Performance Issues: Blending large datasets can often lead to performance issues, such as slower report loading times. Care should be taken to minimize this by only including necessary fields.
- Errors: Improper joining or cleaning of data from different sources can result in costly errors, leading to incorrect analysis and/or insights.
What Are Keys In Looker Studio?
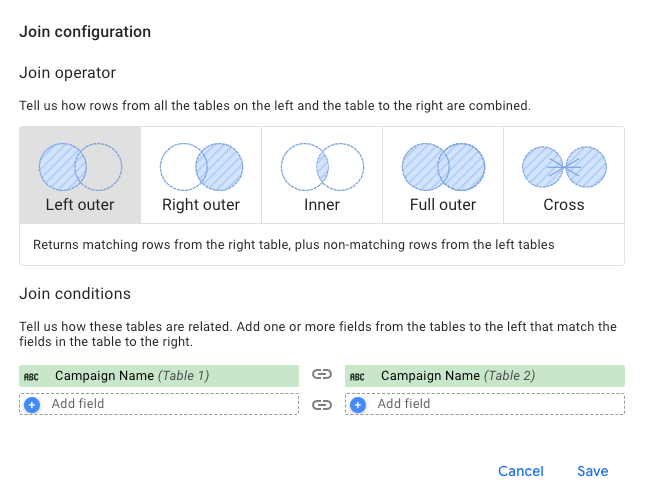
To blend data in Looker Studio, we must first understand keys and the different types of joins available.
A key in data blending terms is a field in one table that has the same information as another field in another table.
Keys act as the bridge between different tables, enabling the merging of data into a single cohesive table.
Things To Consider When Selecting Your Key(s)
Selecting the appropriate key(s) is essential for accurate data blending results. Consider the following when selecting your joining key(s):
Common Fields: The selected key(s) must be a field shared between both datasets.
Unique Values: Ideally, the key field should contain unique values for each record to avoid incorrect matches. However, this may not always be feasible, especially when dealing with larger datasets.
Matching Data Types: Ensure the data type of the selected key field is consistent across all datasets. For instance, if the key is a date, it should be formatted as a date in both datasets.
Consistent Formatting: Maintain consistent formatting of the key field across all datasets. For example, if using a campaign name as the key, ensure naming conventions are consistent throughout the all datasets.
Understanding Joins In Looker Studio
There are 5 types of joins in Looker Studio, understanding each so that you can select the correct join is crucial to ensure your insights are accurate and valuable:
Inner Join: Returns records with matching values in both tables.
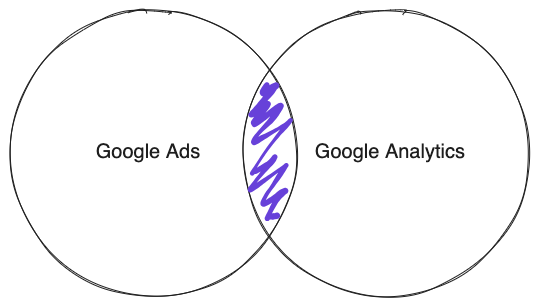
For example, let’s say we wanted to find out more information on how our Google Ads campaigns are performing via Google Analytics.
An inner join of our Google Ads and Google Analytics tables with the join key set to: Campaign Name, will return all data where there are matching campaign names in both tables.
Therefore, allowing us to add additional data to our ads table such as Average Session Duration, or Bounce Rate.
Left Join: Returns all records from the left table and only the matching records from the right table.
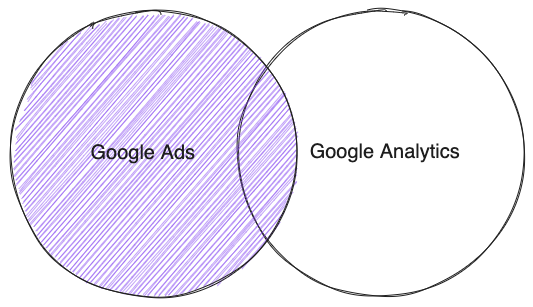
If we were to use the previous example, with the Google Ads table on the left, and the Google Analytics table on the right; the result would return all campaigns from Google Ads with the Google Analytics campaigns that match appended.
Right Join: Think of the right join as a left join in reverse. It returns all records from the right table and the matching records from the left table.
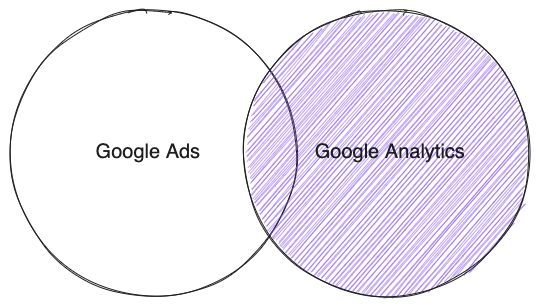
In our case study, it’d return all records from the Google Analytics table, and only the rows with a matching Campaign Name from the Google Ads table.
Full Outer Join: Returns all records when there is a match in either the left or the right table.
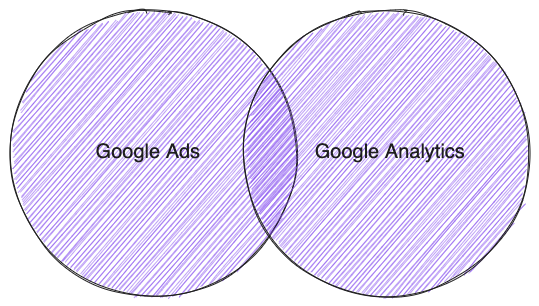
In our example, it would return all campaigns from both tables.
If there’s a match between the two, those records will be included as well.
Cross Join: Less common, returns the Cartesian product of both tables.
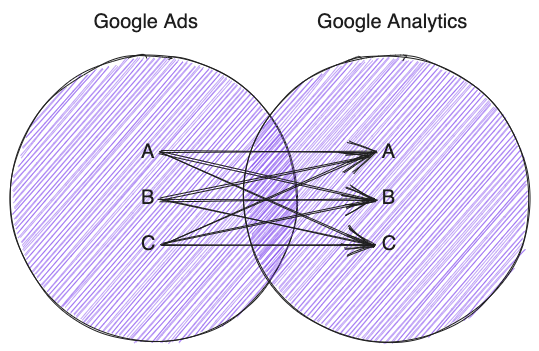
Essentially, this will return all possible combinations of records from the two joined tables, i.e., each row in a table is combined with every row in another table.
How To Set Up A Data Blend In Looker Studio
To begin blending data in Looker Studio, follow these steps:
- Open Report: Begin by navigating to your Looker Studio report.
- Add Data Sources: Select the data sources you want to blend, remember, Looker Studio allows for a maximum of 5 at a time.
- Initiate Blend Data: Click on the ‘Blend Data’ button to initiate the blending process.
- Select Join Keys: Choose the common fields (join keys) in your data sources that Looker Studio will use to merge and blend the data.
- Rename, Add, or Remove Fields: Customize your data blend by renaming, adding, or removing fields as per your analysis requirements.
- Save the Blend: Once satisfied with the blending setup, save the blend, and it will appear as a new virtual data source in your report.
After blending your data, the resulting blended data source acts as a virtual data source within Looker Studio. This new data source can be utilized just like any other data source, allowing the creation of various visualizations such as charts, tables, and more using the blended data.
To access the blended data, click on the ‘Resource’ tab in Looker Studio, then ‘Manage blends’.
Conclusion
Looker Studio’s blending capabilities allow you to quickly create a holistic view of your customer’s journey by combining data from multiple sources such as CRM’s, analytics platforms, ads accounts and more.
And thus, you unlock the ability to create more powerful visualizations that leverage different datasets, providing deeper insights into your data.